Arterial Spin Labeling
- Introduction
- A Little History
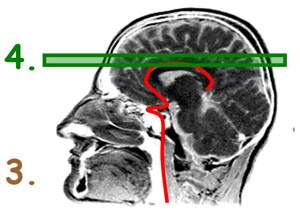
- How does ASL work?
- ASL Summary (Generalized)
- ASL techniques
- ASL versus BOLD fMRI
Introduction
"The subject to be observed lay on a delicately balanced table which could tip downwards either at the head or at the foot if the weight of either end were increased. The moment emotional or intellectual activity began in the subject, down went the balance at the head-end, in consequence of the redistribution of blood in his system." -William James (1890)
Ideally, scientists would like to measure neural activity directly. However, as this is nearly impossible under normal circumstances, most researchers have chosen to observe the changes in the metabolic activity that follow mental work using techniques such as BOLD. Though measuring changes in blood flow as a consequence of neural activity would be the next most direct approach, this was formerly only obtainable through the use of invasive imaging techniques utilizing exogenous contrast agents. Thus, most researchers opted to use the BOLD technique, which though dependent on cerebral blood flow (CBF), does not give a direct measure of it. However, due to recent advances in MR imaging, it is now possible to capture CBF measurements entirely non-invasively.
One technique currently being explored by the UMICH fMRI lab, is arterial spin labeling (ASL), which allows the weighting of the MRI signal by cerebral blood flow.
A Little History
"Perhaps no other organ of the body is less adapted to an experimental study of its circulation than the brain." -Carl Wiggers (1905)
Prior to ASL, the techniques used for determining cerebral blood flow were rather invasive and involved the use of exogenous contrast agents, such as like the 15O H2O radiotracer in Positron Emission Tomography (PET). In this technique, researchers inject a radiotracer (which was essentially radioactively labeled water) into the participant. This radiotracer would then circulate through the body's vascular system, ultimately diffusing freely into brain tissue along with the blood. The radioactive tracer would begin to decay almost immediately, emitting tiny positively charged particles (called positrons) which could then be detected using specialized equipment. As the radiotracer travels with the blood, the amount of radioactvity detected reflects blood flow. That is to say, areas which received a lot of blood should also have received a lot of radioactively labeled water and consequently shown higher levels of radioactive positron emissions. Thus, in for each region of brain tissue, uptake of the radiotracer would be proportional to blood flow.
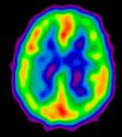
An image generated from a 15O H2OPET study. Red areas show the highest levels of blood flow/radiotracer uptake, blue areas the lowest.
The principles behind ASL are quite similar to those utilizing exogenous contrast agents. However, ASL is completely non-invasive (no injections) and the tracer used is not radioactively labeled water, but magnetically labeled water.
How does ASL work?
"Aristotle taught that the brain exists merely to cool the blood and is not involved in the process of thinking. This is true only of certain persons." -Will Cuppy
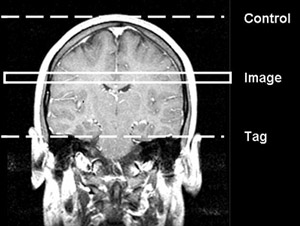
Similar to PET techniques, ASL utilizes a tracer of sorts. In ASL, arterial blood water is magnetically labeled then imaged. First, arterial blood water is magnetically labeled just below the region (slice) of interest by applying a 180 degree radiofrequency (RF) inversion pulse. The result of this pulse is inversion of the net magnetization of the blood water. In other words, the water molecules within the arterial blood are labeled magnetically. After a period of time (called the transit time), this 'paramagnetic tracer’ flows into slice of interest where it exchanges with tissue water. The inflowing inverted spins within the blood water alter total tissue magnetization, reducing it and, consequently, the MR signal & image intensity. During this time, an image is taken (called the tag image).
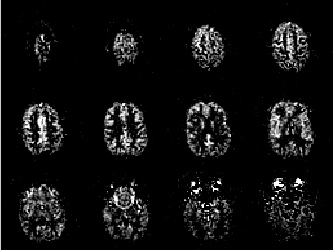
Examples of ASL images
The experiment is then repeated without labeling the arterial blood to create another image (called the control image). The control image and the tag image are subtracted to produce a perfusion image. This image will reflect the amount of arterial blood delivered to each voxel within the slice within the transit time.
ASL Summary (Generalized)
Tag inflowing arterial blood by magnetic inversion
-
Acquire the Tag Image
Repeat experiment without tag
-
Acquire the Control Image
-
Subtract: Control Image - Tag Image
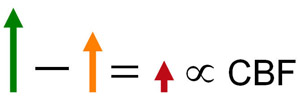
The Difference in magnetization between control and tag conditions is proportional to regional cerebral blood flow.
ASL techniques
There are several approaches to ASL perfusion imaging:
CASL
CASL, or continous ASL, where the inversion of the arterial blood occurs continuously through the application of a continuous RF pulse. During the acquisition of the control image, an RF pulse is supplied above the image slice to account for magnetic distortions caused by the pulse itself, but the pulse itself will not label any blood. This method of inversion is also called flow-driven inversion.
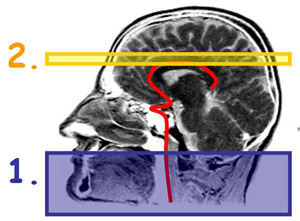
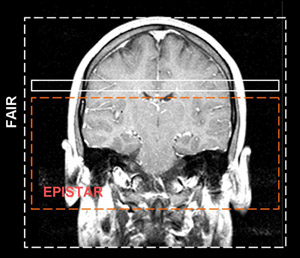
PASL
PASL, or pulsed ASL, where the inversion of the arterial blood occurs over a specific area. The RF pulse is applied in a spatially selective manner (slice-specific). Several versions exist, including EPISTAR (echo planar imaging and signal targeting with alternating radiofrequency) and FAIR (flow-sensitive alternating inversion recovery). Please refer to the image on the right. These methods of inversion are also referred to as spatial inversion.
ASL versus BOLD fMRI
How do the results obtained from ASL experiments differ from those obtained with BOLD? How do BOLD and ASL differ?
- ASL noise is a lot whiter than BOLD noise. (Wang 2003)
- ASL does not require contrast agents (that's the whole point).
- Changes in perfusion are more localized to the parenchyma, whereas BOLD changes are tied to the veins and venules (Duong 2002).
- It does take longer to collect a single ASL image, though, but we can go as fast as 2.5 seconds for a subtraction pair with our methods. After sinc subtraction, we end up with an ASL image every 1.2 seconds. With BOLD we can get the images in less than 500 msec.
- We get less slices at a time with ASL, and they tend to be thicker. I hesitate to give numbers about this.
- ...there's more
In addition to the items mentioned above, it also turns out that the change in ASL signal that results from activation is cleaner than what is normally observed in utilizing your average BOLD technique. This is illustrated in the image given on the right which shows the results of an experiment that was first conducted using CASL and then repeated using BOLD.
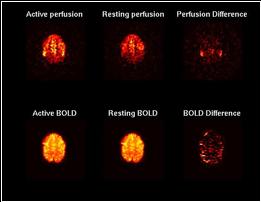
The top row shows 2-coil CASL images and the bottom one shows BOLD images. We used the same TR (4 seconds) and spiral acquisition in both ASL and BOLD. The left column of images were averaged over 4 minutes of rest. The middle column of images were averaged over four minutes of finger tapping. The right column is simply the difference of the other two columns - No modeling, filtering, regressing, or anything. Just subtraction.
As you can see, ASL images are intrinsically a lot noisier, in fact, they look awful, you can barely see the white mater... but the change in ASL signal that results from activation is huge (we observe 50%, or even more).