Arterial Spin Labeling
The brain’s metabolic activity requires nutrients to function. As function goes up, so does the demand for oxygen and glucose and the brain tries to make up the demand by dilating the arterioles, which results in an increase in blood flow to the area. There is a complicated chain of chemical signals that lead to this vasodilation but we will not talk about that here. Importantly, though, the increase in blood flow tends to overcompensate the demand I the short term.
This property of the brain’s vasculature is very useful in that it makes blood flow a very good marker of neuronal activity. It is spatially coarse and a bit slow, but detecting changes in flow is a great way to detect changes in activity. From a clinical point of view, this is very valuable as it tells you if brain tissue is healthy or not. For example, tumors are very active and demand a lot of blood flow. Some neurodegenerative diseases reduce the blood supply.
From a cognitive neuroscience point of view, blood flow is a great way to map brain function in the brain. We can look for changes in blood flow during a mental task and those changes can tell us which regions of the brain were responsible for that mental task. Neuroscientists have been using this sort of idea since the 80’s, primarily through PET scanning.
So, how does one measure blood flow in the brain?
One way is to measure the velocity of arterial blood with doppler ultrasound, or phase contrast MRI, but that’s not very good for brain mapping. A better way to get images of blood flow is to inject some sort of tracer and then collect images of the tracer and see how much tracer accumulated int each region over time. More tracer accumulation implies more flow to the area.
At this point, let’s take a moment to make a distinction between blood flow and perfusion. Technically speaking, blood flow refers to the blood that is in the larger vasculature, whereas perfusion refers to the blood that gets into capillaries and exchanges nutrients and water into the tissue. Perfusion is generally a finer indicator of where brain activity happens.
At any rate, tracer injections were used since the fifties to measure perfusion in different organs. PET scanners use radioactive water to measure perfusion, in addition to being able to trace radioactively labeled glucose or receptor binding molecules. MRI offers exquisite spatial resolution and detail, and it can also be used to measure perfusion by injecting contrast agents that will affect the MR signal, typically different gadolinium compounds.
However, injecting tracers is not very practical. There is the obvious fact of having to stick a needle in a participant, then there is radiation or toxicity, and the fact that it takes time for the tracer to leave the body before we can repeat the experiment… and then there is the fact that that the injection’s contents (‘bolus’) spreads out before it gets to the brain and it makes it harder to calculate the perfusion rate.
And that’s where arterial spin labeling (ASL) comes in. Imagine that instead of injecting a tracer, we could create a tracer just upstream of the brain (or another organ) without actual injection. ASL does exactly that by using radiofrequency pulses that change the magnetic state of the water molecules in the blood just before they get into the brain. As they get into the brain, they will affect the signal intensity of the image.
There are multiple schemes of pulses and image acquisitions that you can use, but the most popular and effective one at this time is the “pseudo-continuous” ASL technique, depicted in the cartoon.
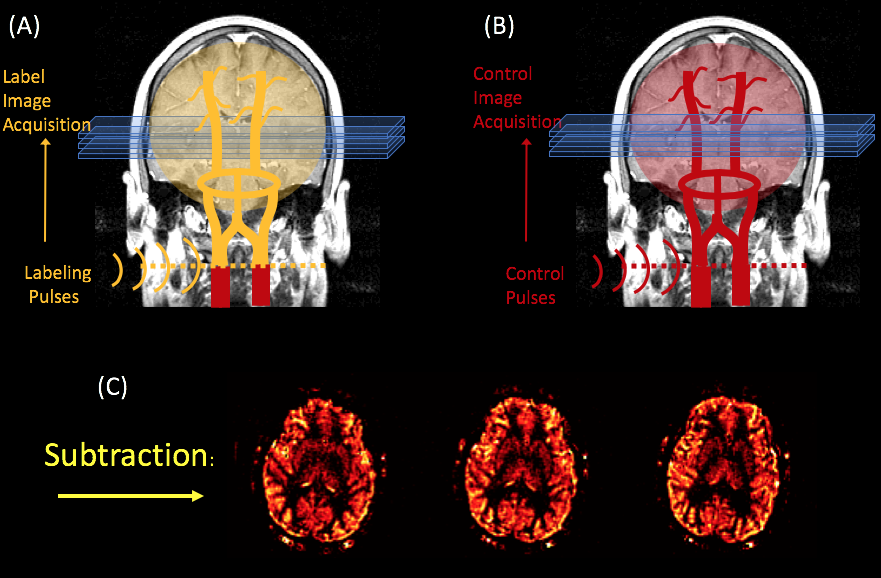
In PCASL, we use a long train of pulses applied at the neck to generate a long "bolus" of labeled spins. The labeling process consists of inverting the magnetization of the arterial blood's water protons, as they cross the plane where the RF pulses are applied. After a couple of seconds (an interval referred to as the bolus arrival time), a labeled image of the brain is acquired which is sensitized to pick up signal from the labeled blood.
In order to quantify how much of the labeled blood has perfused the tissue, a control image (without the label) is acquired to compare against the labeled image. This control image needs to have the same properties as the labeled image, except for the actual labeling.
At this point, the perfusion rate can be quantified from the subtraction image, by multiplying it by a number of scaling parameters that are related to the experimental conditions. For example, see Alsop et al's paper for the PCASL case.
Here is an animation of the process:

Processing ASL Datai with FASL (FASL02)
There are a number of tools that you can use to process ASL data. Our lab uses and "supports" FASL (functional arterial spin labeling). The latest version of is shared through a GITHUB repository for FASL
Andy Jahn has a great tutorial on how to use the FASL tool for FMRI processing in his excellent ANDY's BRAIN BOOK:
FASL is made of home written Matlab code, but it also relies on the SPM12 libraries. You will need SPM12 installed in your machine for FASL to work properly.
ASL images are collected for two different "modalities".
The bulk of ASL studies are clinical and the goal is to obtain a single perfusion image per session. This image may be quantitative, or simply "perfusion weighted" where the resulting image intensity is proportional to perfusion, but the intensity values don't necessarily correspond to a perfusion rate. Most of the time, the scanner will process the data for you and produce perfusion images, but FASL can be used to make these computations as well, in case you need to do so because you have your own sequence.
A variation on this application is to calculate multiple parameter maps from multiple pairs of control-labeled images . The parameters calculated are usually perfusion and bolus arrival time, although there are other interesting parameters that can be obtained. These are calculated from image pairs collected with an ASL sequence that is repeated with several post-labeling delays. (This is not a product sequence in most scanners). The parameter maps are the result of fitting an ASL kinetic model to the data. We haven't implemented this in FASL yet, but Oxford's BASIL in FSL is great for this.
(OK - so there are more than two modalities ... in fact there are a lot of different applications, but let's keep it simple :) )
The second type of applications for ASL is functional MRI studies. This means collecting a time series of ASL images while the participant performs a mental task. (This the main application of FASL at this time). The analyis is very similar to that of BOLD weighted FMRI, but there is the added benefit of quantifying perfusion and perfusion changes from the parameter estimates. This is potentially very beneficial because it produces quantitative activation maps in units of perfusion. It can also reduce the variance of results across populations and across scanning sites!
Although both ASL and BOLD contrast are used to measure brain activity through the vascular response, there are several important differences between the two:
- ASL images are noisier than BOLD images. However, ASL noise is whiter than BOLD noise (Wang et al., 2003). So, in the LONG TERM, Perfusion is less variable than the BOLD signal. This is very good for slow stimulation paradigms and longitudinal studies.
- Changes in perfusion are more localized to the parenchyma, whereas BOLD changes are tied to the veins and venules (Duong et al., 2002).
- It takes longer to collect a single ASL image - around 4 seconds, versus 500ms for BOLD images acquired with multiband.
- We acquire fewer slices at a time with ASL, and the slices tend to be thicker (i.e., the spatial resolution is lower compared to BOLD imaging).
- The perfusion response is less variable across populations than the BOLD response (see (Aguirre et al., 2002 )
FASL has been designed to carry out the analysis of ASL FMRI data at the single subject level. (For population analysis, all the tools are in there and if you are handy with Matlab it's pretty straighforward, but the graphic interface doesn't support it yet … sorry)